The 'Fish at Depth' Viewer1


Sherman R. Lai* and Line B. Christensen**
*Syracuse University, srlai02@syr.edu
**University of British Columbia, line@interchange.ubc.ca
 
Abstract
 

       A procedure is described which simulates the colour-specific light attenuation process that occurs as one moves into deeper waters, along with the dilation of the eye's pupils. It is shown how this procedure can be applied to fish images, such as incorporated in FishBase (www.fishbase.org).

Introduction
 

       Our 'Fish at Depths' Viewer is a Java-based utility designed to imitate the colour changes apparent in, e.g. fish, as witnessed by a diver changing depth, and serves to create a feel for the colour distortion that occurs as light is absorbed when it passes through water. This creates a visual diving simulation; an opportunity for divers to experience that fish colours will look different, depending on dive depth. 'Fish at Depths' was designed to work as a routine of FishBase (see www.fishbase.org) but may also be adapted to other uses.

Methodology
 

       The transformation of colour in water depends on the attenuation of light. The brightness of different colours depends on how many photons reach the eye's receptor cells. This number of photons, in turn can be modulated by dilation of the eye's pupil. Other factors such as refraction, which distorts the appearance of objects, play a secondary role when considering the visibility of objects.

       Various assumptions were used here for the sake of simplicity, to increase computational efficiency. The water is assumed to be clean and still. The diver is wearing clear goggles, and the normal adaptation process by the pupil, which usually lasts about 20 minutes is here assumed to be instantaneous. Furthermore only photopic (day) vision is simulated; mesopic (twilight) and scotopic (night) vision are ignored. For the purpose of keeping the simulation simple enough for efficient computation, we incorporated only light attenuation and pupil dilation effects.

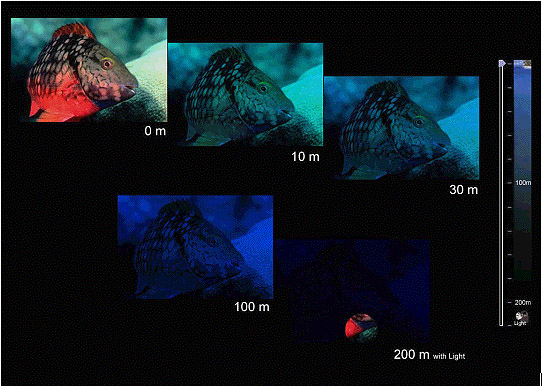
       Light is attenuated through two processes. A large fraction of the photons of each wavelength is absorbed by water, the rest being scattered by organic and inorganic particles residing in the water. The blue and green colours in the visible spectrum are propagated into deeper waters, while colours such as red and yellow are lost after a few meters.

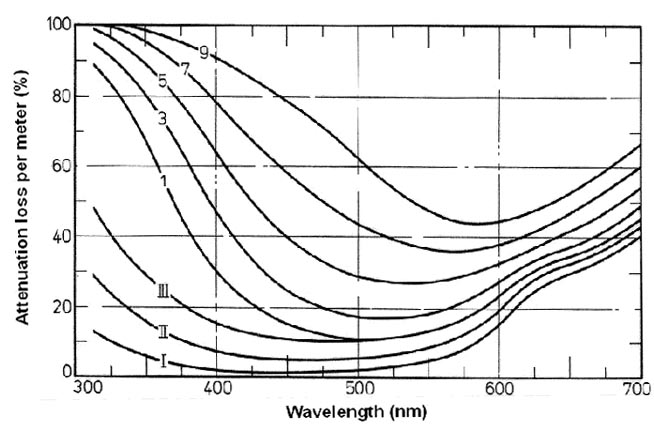
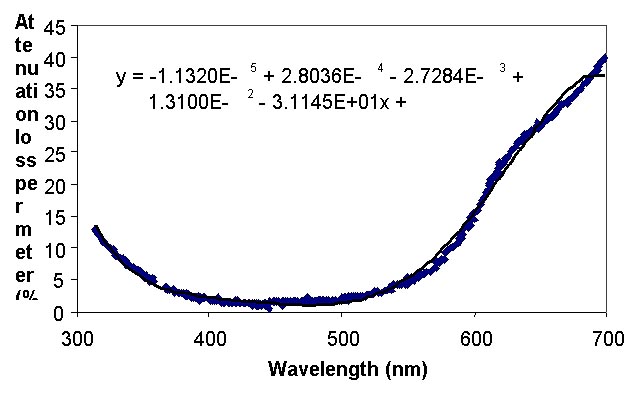
       Computer colour monitors consist of a grid of pixels, each with a value representing its colour. Using relative proportions of red, green and blue, all hues can be represented. The percent decrease of light per meter is known for all wavelengths (Figre 1). Thus, we can represent the colour change through water using the decreases by depth for red, green and blue (RGB). The wavelengths corresponding to these colours are given in the second column of Table 1.

Table 1. Key features of Red, Green and Blue.
 Colour Wavelength (nm)a) Loss per meter (%)
 Red 701.0 28.60
 Green 525.5 2.78
 Blue 444.3 1.37
a) Wavelengths (nm) for each RGB component were obtained from http://www.geo.fmi.fi/~tmakinen/kw_rgb.shtml; August 11, 2001.


Figure 1 - Percentage light loss per meter as a function of wavelength in different types of water: I = extremely clear oceanic water; II = tropical/subtropical oceanic water; III = Oceanic water at temperate latitudes. Curves 1-9: Coastal waters with varying degree of turbidity (from Jerlov 1951, in Dietrich et al. 1975, p. 84).

       The RGB wavelength components of curve I in Figre 1 were read off, and fitted with a 5th-order polynomial. This resulted in the equation in Figure 2, which was then used to predict the colour-specific attenuation coefficients in the third column of Table 1.


Figure 2. Relation between light attenuation and wavelength, based on Curve I in Figure 1.


       Decreasing the intensity of the RGB values in each pixel follows directly from this. Dilation of the eye, the second factor influencing underwater vision, can now be considered. The human pupil is designed to constrict and dilate to control the number of photons entering the eye. The radius of the pupil varies from between 1 mm when fully constricted and 4 mm when fully dilated (Daugman 2001). In terms of surface area, this is a 16-fold increase, and thus the eye can fully compensate for up to a factor of 1/16 decrease in light intensity, i.e., of irradiance. To find the maximum depth to which the human eye can compensate for decreasing light intensity, it is necessary to establish the depth at which 1/16 of the surface irradiance remains. Figure 3 shows the total irradiance levels between 0 and 600 meters obtained from integrating the spectral distribution of irradiation at various depths in Crater Lake, Oregon, USA).


Figure 3. Total irradiance at various depths in freshwater (from Smith and Tyler 1967 in Kinney 1985, p. 65).


       The curve in Figure 3 can be reproduced by Total irradiance = 23579×e(-0.0286*Depth) where irradiance is in micro watts/cm2, and depth in meters. At the surface we thus have total irradiance of 23579 micro watts/cm2. The depth at which the total irradiance is 1/16 of this is thus estimated at about 100 m. When the depth is set to anything less than 100 meters (luminance depth), each RGB component should be decreased by its corresponding percentage loss per meter corrected to allow for the pupil dilation effect. However, it would be inaccurate to push every RGB up to 100% to achieve this, as the colours would not change. Rather, the colours must change while the decrease in light intensity is minimized. To do this rigorously, the overall intensity of the picture would have to be integrated. As this would considerably slow down the computation, we instead decreased all the colours by the same relative amount, then increased them by the smallest percentage loss among the three component colours (i.e., blue; see Table 1). This is shown in the pseudo code of Box 1.

 
  Box 1: Scaling for eye dilation
  if (depth less than or equal to luminance depth(100m))
 
        red pixel value times 0.72772^depth
            // 1 - 0.2860091 + 0.01373224
        green pixel value times 0.98593^depth
            // 1 - 0.0277985 + 0.01373224
        blue pixel value times nothing
            // 1 - 0.01373224 + 0.01373224


       Once the depth reaches 100 m, below which the eye no longer can compensate for loss in luminosity, the RGB components decrease by their relative percentages. This is shown in the pseudo code of Box 2.

 
  Box 2: Calculation of RGB components relative to depth beyond 100 meters.
  if (depth greater than luminance depth (100m))
        temp = 0.72772luminance depth;
        temp2 = 0.98593luminance depth;
 
        red = red pixel value * temp * 0.71399depth - luminance depth;
            // 1 - 0.2860091
        green = green pixel value * temp2 * 0.97220depth - luminance depth;
            // 1 - 0.0277985
        blue = blue pixel value * 0.98626depth - luminance depth;
            // 1 - 0.0137322
 
 
This yields the results illustrated in Figure 4.


Figure 4. Composite illustration of the change of appearances of a reddish parrotfish at 0, 10, 30, 100 and 200m, the last with an illuminated spot (a 'flashlight').

       To work this program, the user should simply slide or click the slider to the appropriate depth shown on the right side. To compare the image at a current depth to the original image at or near the surface, press the 'flashlight' on the bottom right of the slider and move the mouse over the picture. This simulates a flashlight artificially lighting the image, i.e., simulating surface irradiance.

Acknowledgements

       We thank Dr Daniel Pauly for the idea of this 'in depth' viewer, and for supplying key references, and Dr Villy Christensen for his support.

Bibliography
Daugman, J., 2001. Iris recognition. American Scientist (July-August) 89: 326-333. Dietrich, G., K. Kalle, W. Krauss, and G. Siedler, 1975. Allgemeine Meereskunde Gebrüder Borntraeger, Berlin & Stuttgart, 593 p.
Jerlov, N.G. 1951. Optical Studies of Ocean Water. Reports of the Swedish Deep-Sea Expedition 3:1-59.
Kinney, J.A.S. 1985. Human Underwater Vision: Physiology and Physics. Undersea Medical Society, Bethesda, 179 p.
Smith, RC. and JE. Tyler 1967. Optical properties of clear natural water. Journal of the Optical Society of America 57:589-595.
Steemann-Nielsen, E. 1955. Production of organic matter in the oceans. Journal of Marine Research 14(4): 374-386.